What's Using Your Electricity? Find Your Home's Phantom Loads
Your home draws power around the clock, even when you think everything is off. The set-top box, the printer, the gaming console, the charger drawer — they all sip electricity 24/7. Utilities call it "standby" or "phantom" load, and it can quietly add up to 10% of a monthly bill.
This guide is the practical follow-up to our live Canada–US grid map: if you've ever wondered what your own slice of that load looks like, here's how to measure it — with three tools at three price points.
How much power do "off" devices actually draw?
Lawrence Berkeley National Laboratory has studied standby power for two decades. Their finding: a typical home's always-on devices consume roughly 5–10% of total household electricity just idling. On a $150 monthly bill, that's $7–$15 a month — or up to $180 a year — powering nothing you're actually using.
Three ways to measure it (pick your budget)
Which tool is right depends on how deep you want to go. All three work — they differ in effort and what they can see.
As an Amazon Associate, PowerTrip earns from qualifying purchases — details at the end of this guide.
P3 Kill A Watt (P4400)
The classic plug-in watt meter. Plug it into the wall, plug the suspect device into it, and read live watts and cumulative kWh. Perfect for auditing one appliance at a time — the "borrow and move" approach.
- Best for: auditing a handful of suspicious devices
- Effort: zero — plug and read
- Limitation: one device at a time, no history or app
Kasa Matter Smart Plug with Energy Monitoring (2-pack)
The Kasa KP125M does double duty: it reports each device's real-time and historical consumption in the app, and can be scheduled off automatically. A console scheduled to cut power at midnight stops being a phantom load forever.
- Best for: TVs, consoles, printers, chargers — anything on a plug
- Effort: low — app setup once, then forget it
- Limitation: 15A/1800W max — not for space heaters or dryers
Emporia Vue 3 Home Energy Monitor
The Vue 3 installs in your electrical panel and meters up to 16 individual circuits in real time. You see your furnace, water heater, EV charger and everything else as separate lines on one chart — the fastest way to find the circuit that's quietly burning money.
- Best for: finding whole-circuit loads, tracking your total against your bill
- Effort: panel installation required (DIY-capable, or one electrician visit)
- Limitation: needs Wi-Fi; panel access required
Amazon prices shown at publish time; check the product page for the current price.
The 10-minute audit that pays for itself
Don't overthink it. Grab any of the three tools above and work through the suspects in this order:
- Entertainment corner — TV, console, soundbar, set-top box. Often 10–40W combined while "off."
- Home office — desktop PC, monitor, printer, speaker. Sleep mode isn't zero.
- Kitchen counters — coffee maker, toaster with clock, microwave (the clock costs more than you think).
- Charger cluster — phone/tablet/laptop chargers left in, plus smart speakers.
Anything that measures above 2W at idle is worth a smart plug. Anything in the double digits deserves one — or a replacement unit with a true off switch.
What a grid perspective adds
Phantom loads are small at the individual level but enormous in aggregate: multiplied across millions of North American homes, standby draw is a quiet part of why a 3 a.m. on the live grid map still shows meaningful flows. Every console on a smart plug removes a little of that — and your own bill feels it first.
The 10 mistakes people make (and what to do instead)
- Only measuring the big appliances. The fridge you can't change. The router, the gaming console on standby, and the AV receiver are where the silent waste hides — and they're the ones you can switch off.
- Trusting the device's own display. A TV's menu shows its active rating, not its standby draw. Only a meter between the wall and the plug tells the truth.
- Measuring for 30 seconds. Some devices cycle (fridges, dehumidifiers). Leave the meter plugged in for a full day on cycling loads, or your number is meaningless.
- Forgetting the always-on network gear. A modem + router + Wi-Fi extender stack can run 15–25 W around the clock. In Québec, that's roughly $10–17 per year; at average US rates, closer to $25–40.
- Unplugging things once, then re-plugging them. Phantom loads come back. Put the worst offenders on a switched power bar so "off" is one switch, not five unplugs.
Standby draw: what to expect, device by device
| Device (state) | Typical standby draw | Per year, ≈8¢/kWh (QC) | Per year, ≈17¢/kWh (US avg) |
|---|---|---|---|
| Wi-Fi router (on) | 4–8 W | $3–6 | $6–12 |
| Game console (standby) | 2–15 W | $1–11 | $3–23 |
| TV (off, not unplugged) | 1–5 W | $1–4 | $2–8 |
| Chargers left in (2–3 of them) | 1–3 W | $1–2 | $2–5 |
| Microwave (clock) | 2–4 W | $1–3 | $3–6 |
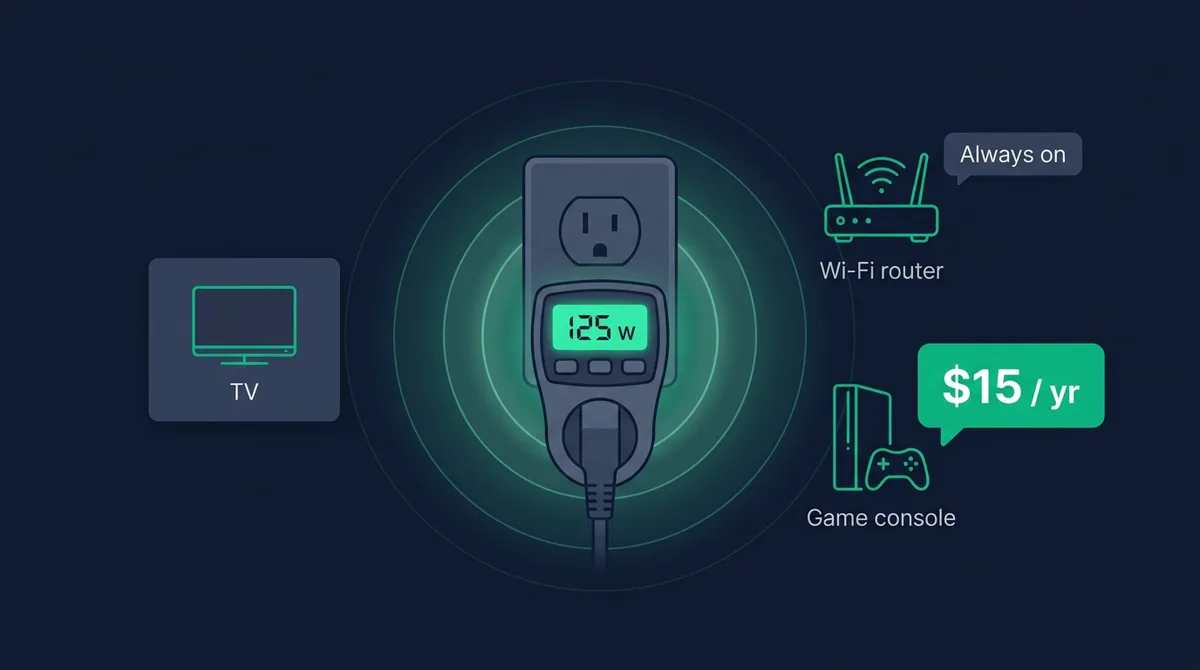
Ranges, not exact figures — which is exactly why the meter matters: your house has your devices, not the averages.
The one worked example worth doing: set the meter on your entertainment stack, leave it 24 hours, then run kWh × 365 × your rate. At 8¢/kWh, every 10 W that runs 24/7 costs about $7 per year; at 17¢, about $15. Five such stacks — and most homes have them — is real money for one afternoon of metering.
What is a phantom load?
A phantom (or vampire) load is the electricity an appliance keeps drawing when it's switched off but still plugged in — TVs, game consoles, chargers, set-top boxes and desktop PCs all do it. The plug measures it, not the switch.
How much electricity do phantom loads use?
Lawrence Berkeley National Laboratory's standby power research puts it at roughly 5–10% of a typical home's electricity use. On a $150 monthly bill, that's $7–$15 a month spent on nothing.
How do I measure a phantom load?
Three ways: a plug-in watt meter for one device at a time, a smart plug with energy monitoring for anything you want to automate off, or a panel-level monitor like the Emporia Vue 3 that meters every circuit at once.